Optimal Shift Point
Skip the BS and go to the calculator.
Calculates the optimal upshift rpm and road speed for each gear of your car to
acheive maximum acceleration. (except
for the highest, of course!)
You provide torque vs. flywheel rpm data, transmission and differential (final) gear ratio data,
and drive wheel diameter for your car.
Once you have input the data and click on the Calculate button, the
optimal upshift rpm for each gear at what road speed is displayed.
Optimal shift point is defined as the flywheel rpm for which the
difference in
transmission output torques
between two gears is near zero for
the same output shaft speed (and same road speed). If the difference never approaches 0, the
optimal shift point is at redline.
Simplified Example: Which is a better shift point from 2nd to 3rd gear, 4000 rpm
or 5000 rpm?
Data: Torque --- 296 ----- 310 ---- 290 ----- 280

- rpm x1000 ---- 2.6 ----- 3.3 ---- 4.0 ----- 5.0


Gear -- 1 --- 2 --- 3 --- 4 --- 5 --- 6

Ratio - 4 -- 2.3 - 1.5 - 1.2 - 1.0 - 0.85
Calculation:
2nd gear Output Shaft Torque @ 4000 flywheel rpm = 290*2.3=667
Output Shaft Speed = 4000/2.3=1739
3rd gear flywheel rpm @ 1739 output shaft speed = 1739*1.5=2600 Output
shaft torque = 296*1.5=444
Torque drop=667-444=223 @ 4000 rpm
2nd gear Output Shaft Torque @ 5000 flywheel rpm = 280*2.3=644
Output Shaft Speed = 5000/2.3=2174
3rd gear flywheel rpm @ 2174 output shaft speed = 2174*1.5=3300 Output
shaft torque = 310*1.5=465
Torque drop=644-465=179 @ 5000 rpm
Since the drop in torque is less at 5000 rpm, this is a better shift
point than 4000 rpm
This utility does this calculation for every 50 rpm step within the
range of data you provide, using straight line interpolation between
data points. It returns the rpm in each gear which yields a torque drop
to the next gear as close to zero as possible. In a output torque vs road speed graph, this would be
where the torque curve lines for two adjacent gears intersect.
In a car with a flat-ish torque curve and
optimal street gearing, the gear-torque curves do not intersect. This means the
optimal shift points will be redline in each gear.
This calculator is a bit simplistic, it assumes a fairly regular torque curve
(not necessarily flat) with only modest bumps and drops along it, in which a gear-torque
curve will only intersect it's neighbor once, if at all. For complex torque curves with major
peaks and valleys, where the gear-torque curve may intersect it's neighbor more than once,
a more rigorous analysis is required. This is best done by entering the above data in
a spreadsheet, along with final drive (differential) ratio and diameter at tire tread
(not wheel diameter).
The final drive and tire info isn't strictly required, but plotting the graph using
actual road speed instead of output shaft speed yields a more meaningful chart. Your
spreadsheet should calculate the actual torque to the wheels (engine torque * gear ratio *
final drive ratio) and the car's road speed in
each gear for the full range of engine rpms. Plot the results as a torque@wheel vs. road speed
chart, a separate torque line for each gear. By examining how each gear curve intersects it's neighbor,
you can reasonably determine the best shift point by locating which gear yields
the highest torque at any given speed.
RPMs entered below must be listed in order lowest to highest, any values beyond the
highest that remain set to 0 will be ignored. Any torque units can be
used as long as all values use the same unit of measure. You only have
10 points available to define the torque curve. Enter points that would
best define the curve using stright line segments. List any rpms you do
not need or gear ratios you do not have at the end as 0.
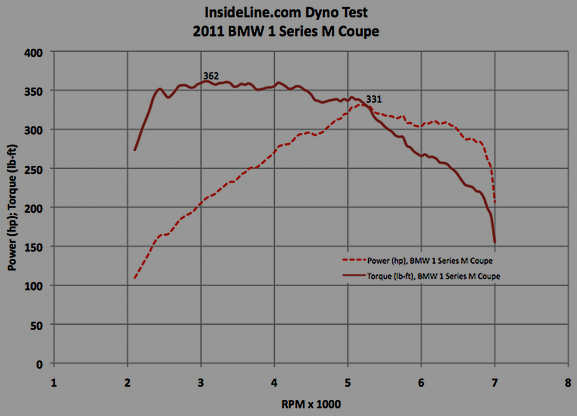
The sample data shown is for a 2011 BMW 1M Coupé from an independent dyno test.
Note the max. torque is well above the value of 332 quoted by BMW. One's inclination
would be that the optimal shift point is 5300 rpm where the torque starts falling off
significantly. This is not the case, the optimal upshift is around 6900 from gears 1 and 2
and around 6000 for the other gears. Even though the torque is falling off, you are still getting
more torque in the lower gear, giving more acceleration. This is an example why this
calculator is useful.
No information entered here is saved, and none of it is sensitive. The data is not even sent
anywhere, it's all kept within your browser.
Data
How is this the correct method? For any point in time, the highest
acceleration is acheived with the highest torque at the wheels. Gears multiply
torque, so generally, the lowest gear provides the highest
acceleration. The problem is, you can't go very fast in 1st gear, so
you need to upshift to go faster, even though it means lower torque
output. As long as the output torque in 1st gear is higher than output
torque in 2nd for a given road speed, you should stay in 1st. Of
course, you will soon run out of rpms and be forced to upshift.
The same holds true for 2nd. As long as the output torque in 2nd is
greater than what you would get from 3rd for any given road speed, you
should continue to accelerate in 2nd. Depending on your car's torque
curve and gearing, there may be a point where, for a given road speed,
you can get the same torque in 3rd as you are getting in 2nd. This is
where you would want to shift, as the torque curve is falling, and
because of the multplying effect of gears, the output torque in second
is falling faster than it would be in 3rd. In this case, more torque is
acheived in 3rd gear, so you should use it.
But once again, if 3rd gear torque never approaches what you are
getting in 2nd, you will eventually hit redline and be forced to
upshift. So in this case, redline would be the optimmal shift point because you
can get more torque at any speed in 2nd than you would in 3rd. And so
on through all the gears...
Copyright © 2012 Glenn Messersmith
 This calculator is licensed under a Creative Commons
Attribution-NonCommercial-ShareAlike 3.0 Unported License. Full code is
available in this page's source code. View with Shift-F12 in IE, or Ctrl-U in most other browsers.
Option+Apple+U for Mac Safari.
This calculator is licensed under a Creative Commons
Attribution-NonCommercial-ShareAlike 3.0 Unported License. Full code is
available in this page's source code. View with Shift-F12 in IE, or Ctrl-U in most other browsers.
Option+Apple+U for Mac Safari.