Display Adjustment
This page contains images I use to adjust TVs and computer monitors. I
am not going to explain how to do this in depth, there are better
references
around. If possible, the first step is ensuring the display is not
having a profile applied to it by software. There's many ways this can
happen, too complex to go into here. Also set the monitor to have, if
possible, a color temperature of 6500°K or sRGB. LCD displays must
also be set to display at native resolution. With LCDs, viewing angle is very
important for these adjustments, ensure your
display is at your optimal angle before starting these adjustments.
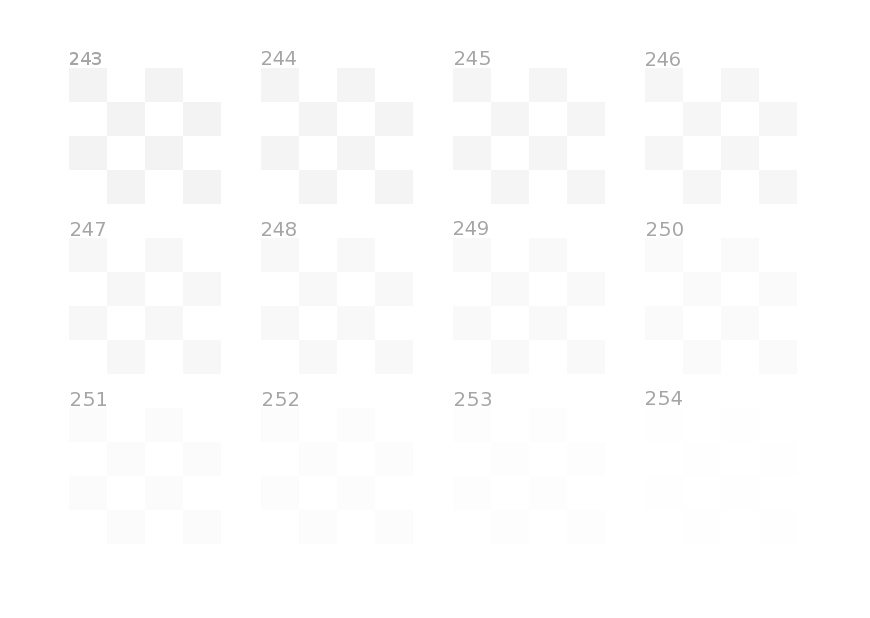
White Level
This is adjusted by the Contrast or Picture control. Turn it up as high
as possible, while still having the 254 checkerboard visible, if
possible, and no color cast at all. At the very least, the 250 level should be visible. The
background must appear as bright white.
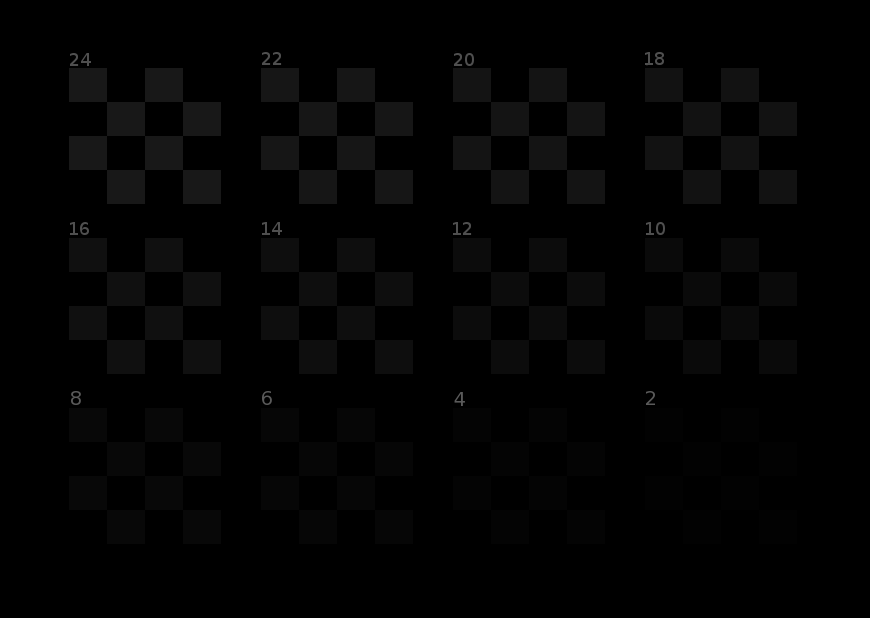
Black Level
This is adjusted by the Brightness or Black Level control. Turn down as
low as possible, while still having the 2 checkerboard barely visible,
if
possible. At the very least, the 10 level should be visible. The
background must appear as deep black.
You may need to go back and forth adjusting the two levels until both
are optimal.
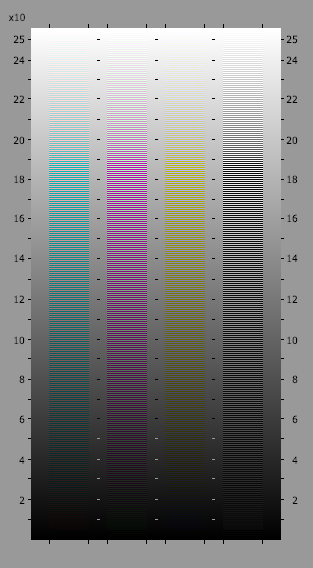
Gamma
If your controls have a gamma setting, use it for the next adjustment.
TVs usually cannot have their gamma adjusted. If your computer has no
way of adjusting gamma, you could install
QuickGamma to get the
functionality. Move your browser window so the test image is centered
in your display.
The test image should look as close to grey as possible.
If the image is coarsely striped, it is not being displayed at 100%,
check your monitor and browser settings. Slight variations in color
indicate a poorer quality graphics card. Try to get it as close to grey
as possible.
This target looks totally grey when your display is using gamma 2.2,
the industry standard, across the entire brightness spectrum. Any
inaccuracies in your graphics card manifest as color casts.
How does the gamma test image work?
Answer
Summary
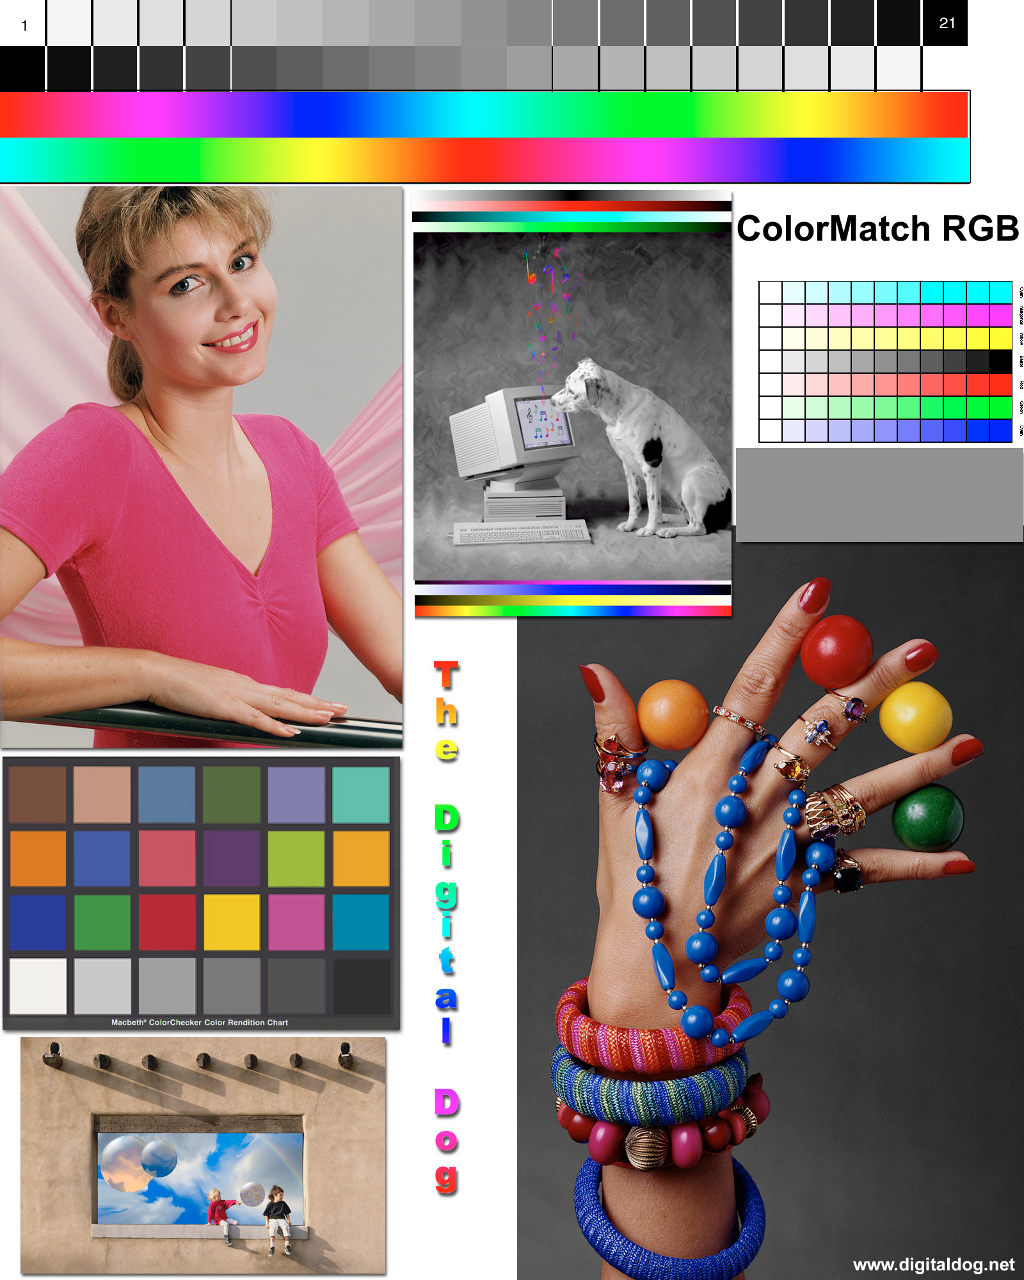
There's much more involved in getting your display to be completely
accurate, but if you completed the above steps, your display is more
accurate than 95% of the displays out there. As a final check, here is
a reduced version of
Digital Dog's test image.
How Gamma Test Image Works
The test image works on the same principle as dithering and sub-pixel rendering, the human eye
cannot discern fine detail, and instead averages adjacent detail elements. This is essentially
how displays can show millions of colors using only 3 different colored LED elements.
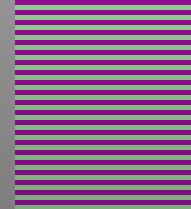
The blown up detail at left shows the colors composing the second vertical bar of the test image.
You can see it is composed of dark magenta and light green stripes. Two adjacent
stripes together have the same mean luminance as the adjacent grey to the left. The color levels are
also calculated so they cancel each other out, resulting in an overall grey, but only
at gamma 2.2. Any other gamma will result in one color dominating the other, giving
the stripe a noticable color cast even if the gamma is only slightly off.
Actually, the test chart will display grey when your display is adjusted to the sRGB
Standard. It is close to gamma 2.2, but it's calculation is more involved. The other complication
is you cannot simply average pixel values to get the desired luminance. The pixel
values have to be decoded to the actual luminance levels before any mathmatical operations
can be performed, using the gamma-power function. Once the proper luminance level is determined,
it is reencoded with the inverse power function to arrive at the nominal pixel value that we want.
It is the application of the power function to one particular color
pair of high and low values that causes a color cast to appear if the display gamma
does not exactly match specification. The sRGB gamma-power function is:
L'=([(P/255)+0.055]/1.055)^2.4
where L' is the Luminance,
P is the actual pixel value
Example:
The grey on the left, near the middle, of the above detail is rgb(137,137,137).
The adjacent color stripes are rgb(137,
187,137) and rgb(137,
10,137).
The only difference in the three colors is the green level. The green level 10 is arbritarily
selected to get the maximum contrast between the two stripes. We can't easily use a level
less than 10 because the sRGB spec calculates low pixel values differently than the
rest of the pixel value range. So all we want is a green level that, when combined with
the 10 level, will appear to have the green level 137 used in the grey.
One may think to get a mean 137, we would need a combination 10 and 264. But as mentioned above,
we can't apply math to pixel values, they need to be converted to luminance levels.
So we plug 10 and 137 into the gamma-power function and get 0.0030 and 0.2502, respectively.
The luminance we need to combine with 0.0030 to get a mean of 0.2502 is thus 0.4973.
So we simply invert the gamma-power function and apply 0.4973 to get a pixel value
of 187. So the color we need to put next to rgb(137,
10,137) for the two together to
appear as rgb(137,137,137) is rgb(137,
187,137).
As long as your display is set to the sRGB spec, the two stripes together will appear
as grey. But if your display gamma is too high, say 2.4, everything will look too dark, and
the combination of green 10 and 187
will appear to be equivalent to green 140, not 137, giving the test stripe a green cast. Conversely,
if your display gamma is to low, say 2.0, everything will look too light, and the combination
of green 10 and 187
will appear to be equivalent to green 133, not 137 giving the test stripe a magenta cast.
(Magenta is the opposite of Green in the RGB-CYM color wheel.)
This test image was fairly difficult to construct, but it's so easy to use! There
are other color stripe gamma test images out there that use the same principle, but nearly
all of them only test the gamma at one to three brightness levels. There's only
one other test image that uses the entire range, but it doesn't model the sRGB spec,
only the more simplistic power function. This is the only test image that tests
the entire brightness range to match the sRGB spec. It is the only test with a scale
so you can see exactly which pixel values are out of spec. It is possible for someone
so inclined to build a custom lookup table that corrects for departures from spec along the
brightness range that most graphics cards inevitably have. The only thing more accurate
is the hardware sensors which attach to your screen and exactly calibrate your display.
These cost a fair bit of money, this test image is free!
The Digital Dog image is Copyright © 2009 Andrew Rodney. My Gamma Test Image
is Copyright © 2012 Glenn Messersmith.
 It
It is licensed under a
Creative Commons Attribution-NonCommercial-ShareAlike 3.0 Unported License.